Last week was a reflection of the past few months:
1) Comments from the Fed heads that they want to tighten, but
2) Slower than expected U.S. economic data
3) Causes reduced interest in the US dollar
4) And increasing interest in Foreign growth
5) While tight credit markets keep the appetite for stocks high.
Some good data below so I won’t draw out this intro. Stay focused overseas. Keep an eye on earnings which will hopefully be better than the reception that the big banks received on Friday. (But don’t worry, the bank disappointments were interest margin and loan growth caused, not credit related.) Technology stocks and the NASDAQ wants to join the rest of the indexes at new highs but they will need earnings to push it forward.
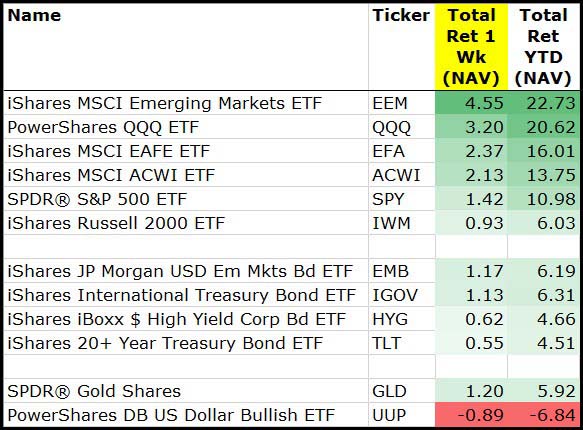
It was a risk on week with the bonus points going to international and technology investments
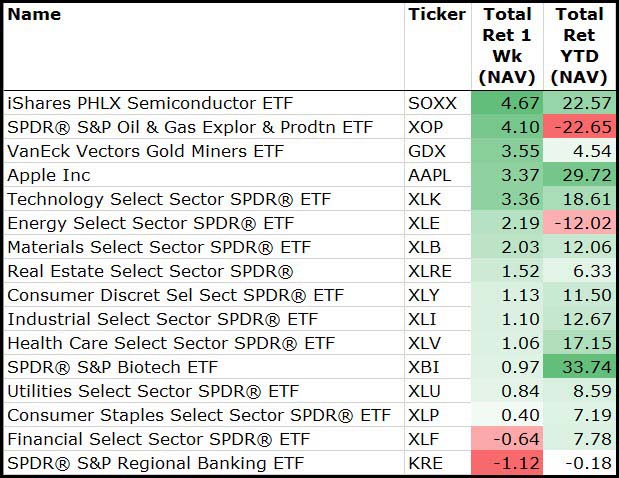
Among sectors, Bank earnings landed like a lead balloon which was the best area of the market to avoid.
Again, Technology led at the top with Energy names putting in a dead cat bounce helped by the Halcon Resources sale.
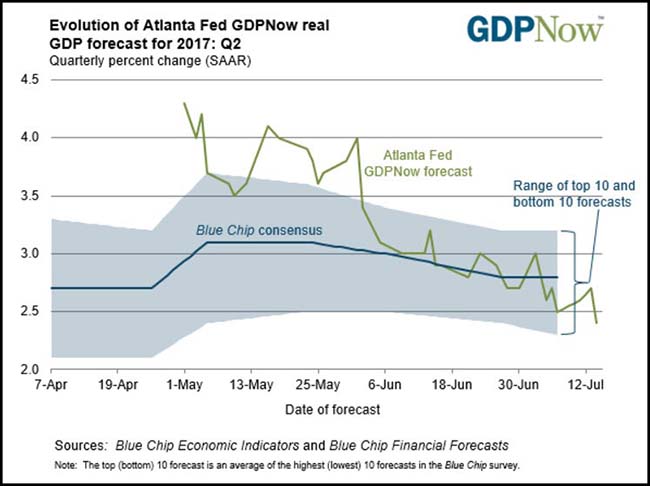
Another week of worse than expected data pushed GDP forecasts lower
Latest forecast: 2.4 percent — July 14, 2017
The GDPNow model forecast for real GDP growth (seasonally adjusted annual rate) in the second quarter of 2017 is 2.4 percent on July 14, down from 2.6 percent on July 11. The forecast of second-quarter real personal consumption expenditures growth declined from 3.1 percent to 2.9 percent after this morning’s retail sales report from the U.S. Census Bureau and this morning’s Consumer Price Index release from the U.S. Bureau of Labor Statistics.
(Federal Reserve Bank of Atlanta)
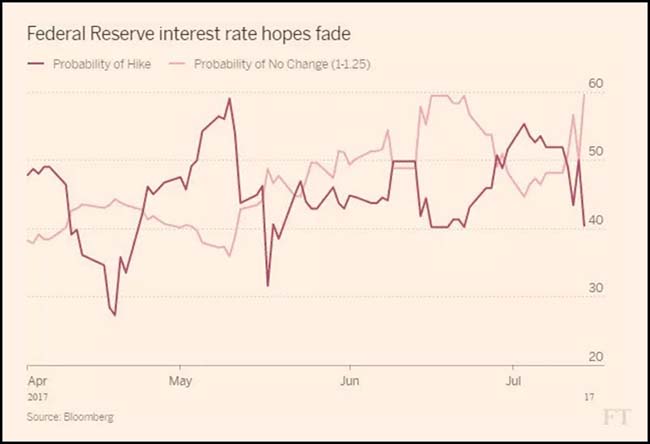
And the financial markets moved toward no more Fed rate hikes for 2017
Which also pushed the U.S. dollar to new lows
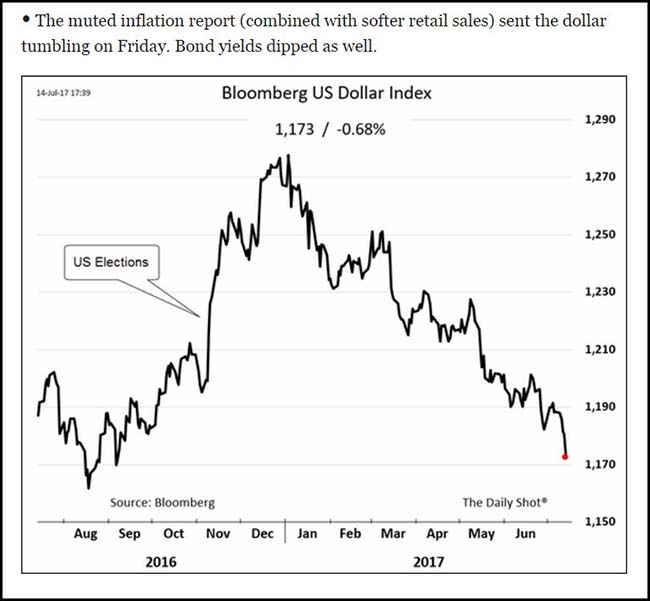
(WSJ/The Daily Shot)
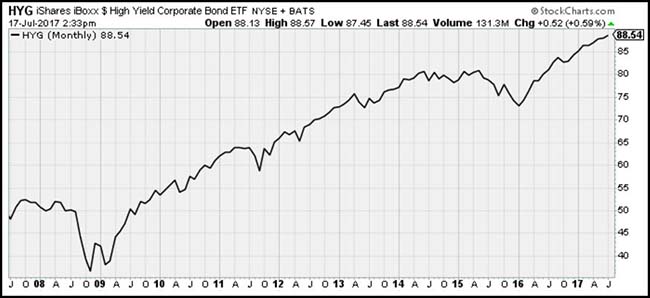
The market backdrop remains healthy as the appetite for credit hits a new all-time high
The Junk Bond ETF is a useful proxy for the market’s interest in lower quality credits. Last week it jumped +1% to a new record level.
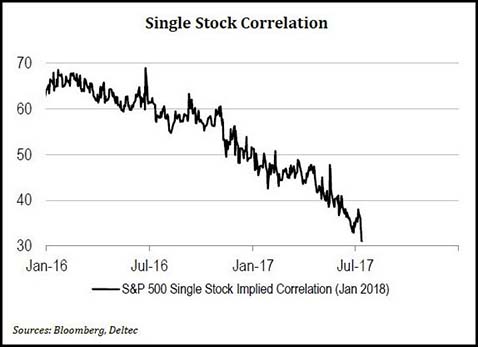
And Active Portfolio managers grab a larger plate, fork and knife
(@zerohedge)
It is a BIG earnings week

(@eWhispers)
One of the more interesting comments from a regional bank earnings call last week
We do have the expectation that construction nationally across all product types and all markets across country is likely to pullback a little bit and whether that number is 10% or 20% I don’t know, but in talking with our customers…they are passing that feedback along to me, cost of labor and materials in some markets are going up significantly. Cost of construction financing is going up…So, it’s costing more…to build things and we are working against a period of years coming out of the great recession, where supply did not keep pace with demand and supply of product and lot of product types has caught up with demand now and lot of submarkets. So, there are lot of markets around the country where you might have had 5 projects coming to market a year ago, but there is really only a need for two more projects coming to market this year and that is slowing the volume to some extent. —Bank of the Ozarks CEO George Gleason (Bank)
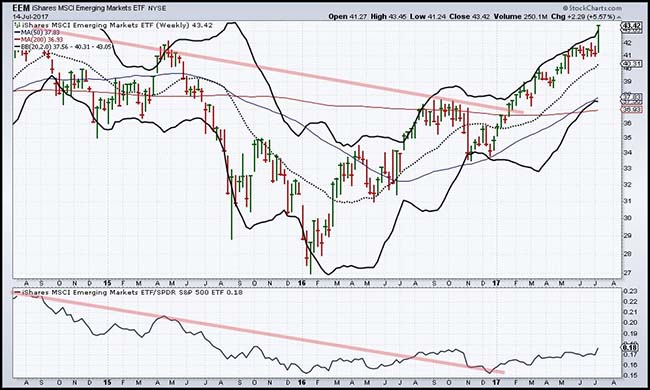
Emerging Markets was the star last week launching +5.5%
(@beckyhiu)
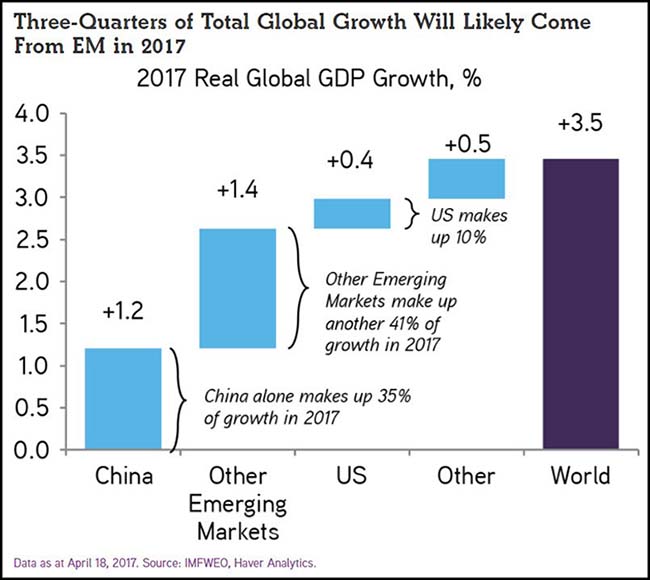
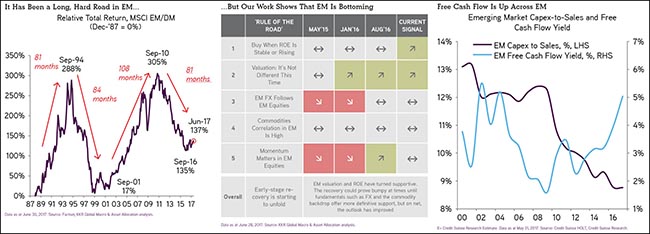
If you need more of a push to get invested in EM, go read KKR’s Henry McVey’s work on the Emerging Markets
He does great work on all of the asset classes but these charts on EM are too compelling to not highlight. Growth + Valuation + Momentum.
(KKR)
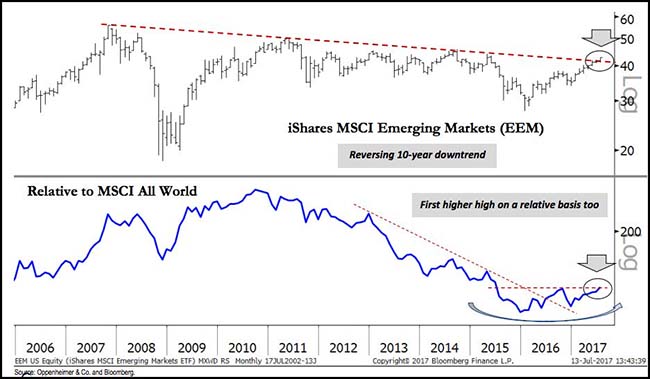
Josh Brown is also highlighting the move in EM
Our chart of the week, month, and potentially year, is the iShares MSCI Emerging Markets’ (EEM) reversal of a 10-year downtrend dating back to its 2007 peak. This not only carries significance for the future direction of EEM’s trend—we think higher—but also for the cyclical recovery as well because broadening global participation remains a focal point to our outlook. Specifically, we see EEM’s reversal as the next step toward our bull case scenario in which global equities, both developed and emerging, join the US in secular rise. It also corroborates our view that the market cycle is early-to-middle innings rather than late. For EEM, the first higher high relative to the MSCI All World index since 2010 argues for continued outperformance, and we accordingly recommend adding to our allocation.
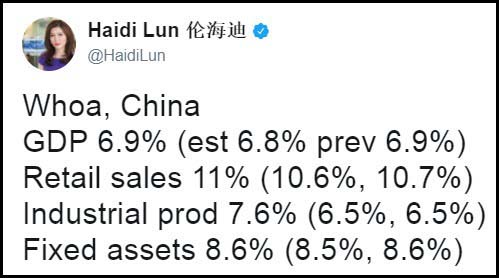
China posted some much better growth figures on Sunday night to help your decision
At the other end of the investment spectrum, Energy stocks look like value traps…
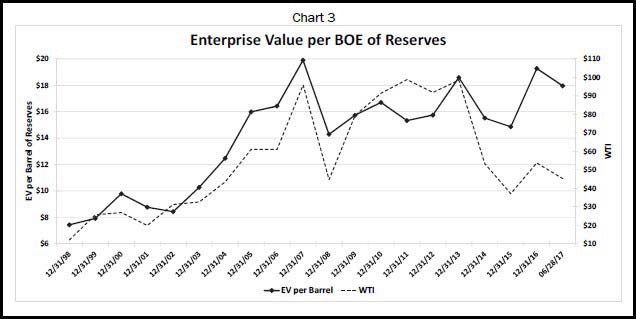
Here is a great chart from the team at The Leuthold Group.
The integrated oils have refining, marketing, and chemical assets along with their energy reserves, but for many E&P companies their intrinsic value comes primarily from assets in the ground. Chart 3 shows the historical trend of enterprise value divided by barrels of energy reserves. Beginning in 2005, investors were willing to pay approximately $16 to $20 per barrel of energy reserves, and the current leading of $18 is on the higher side of last decade.
We overlaid the EV per barrel results with the price of oil (WTI crude) as shown on the right axis. The value of a barrel of oil in the ground should relate somewhat closely to the price of oil, and indeed, the graph matches up nicely until the oil bust of late-2014. Since then, the value of reserves has held steady while the price of crude has dropped significantly. This data can be interpreted several ways: (1) investors are assuming that oil prices will rebound substantially; (2) new reserves will become harder to find, adding a scarcity value to current assets; or, (3) investors have changed their perspectives and no longer value producing companies on their physical assets.
(The Leuthold Group)
Falling energy prices and valuations just zeroed a $2b PE Fund
A $2 billion private-equity fund that borrowed heavily to buy oil and gas wells before energy prices plunged is now worth essentially nothing, an unusual debacle that is wiping out investments by major pensions, endowments and charitable foundations.
EnerVest Ltd., a Houston private-equity firm that focuses on energy investments, manages the fund. The firm raised and started investing money in 2013, when oil was trading at more than double the current price of about $45 a barrel. But the fund added $1.3 billion of borrowed money to boost its buying power. That later caused it trouble when oil prices tumbled…
The outcome will leave investors in the 2013 fund with, at most, pennies for every dollar they invested, the people said. At least one investor, the Orange County Employees Retirement System, already has marked its investment down to zero, according to a pension document.
Though private-equity investments regularly flop, industry consultants and fund investors say this situation could mark the first time that a fund larger than $1 billion has lost essentially all of its value.
EnerVest’s collapse shows how debt taken on during the drilling boom continues to haunt energy investors three years after a glut of fuel sent prices spiraling down.
(WSJ)
Shocking disruption is about to hit the Electric Utility industry
In a new collaborative report, “An Underappreciated Disruptor,” Morgan Stanley’s Utility and Clean Tech analyst, Stephen Byrd and Shared Mobility & Auto analyst, Adam Jonas, argue that the price of both solar and wind energy, as well as new storage units, have reached a point where renewable energy can finally become a dependable rather than an unpredictable source of energy.
“Demand for energy storage from the utility sector will grow more than the market anticipates by 2019-20,” the report posits. The demand for storage is expected to grow from a less than $300 million a year market to as much as $4 billion in the next two to three years, says the Morgan Stanley (NYSE:MS) report. Ultimately there’s about a $30 billion market for storage units, with capacity for around 85 gigawatt-hours of power storage. That’s enough electricity to light up most of the New York City metro area for a year.
There will be winners and losers. Companies with gas-fired plants might suffer margin hcompression as utilities increase their use of cheaper renewable sources on tap in battery storage units. Energy storage will also release stored power during periods of high demand in the early mornings and evenings, when power prices are at their highest — another negative to the bottom line of gas-fired plant owners. “Storage effectively provides a low-cost source of power, eliminating the need for the highest cost, least efficient conventional power plant,” says the report.
(Forbes)
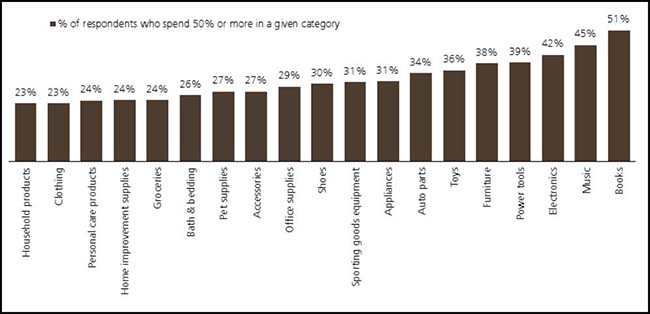
Amazon is the NEW whole paycheck
Percentage of respondents spending 50% or more of their total category spending through Amazon.com (NASDAQ:AMZN)
(UBS)
And for many, Amazon is the low cost solution
The consensus in Iqaluit seems to be that everyone with a credit card has an Amazon Prime membership. That’s because people can often find groceries cheaper online than in local stores, despite government food subsidy programs.
“Amazon Prime has done more toward elevating the standard of living of my family than any territorial or federal program. Full stop. Period,” a local principal, who declined to speak further, said on Facebook (NASDAQ:FB).
Many in town rely on the service for everything from deodorant to hardware supplies to non-perishable food.
Alookie Itorcheak said she’s been using Amazon for four years, to make being a mom more affordable.
A box of 180 Pampers costs about $70 off the shelf in Iqaluit; on Amazon, similar size boxes are around $35.
(CBC)
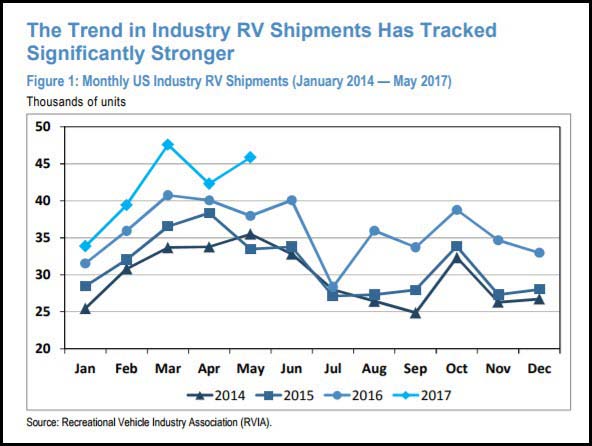
Leisure data point: RV sales are accelerating
(JP Morgan)
Space Geek Chart of the Week
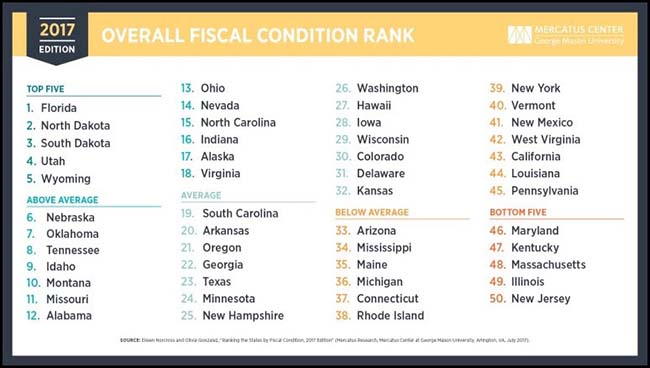
The 2017 Mercatus Center report on State’s financial health has been released
If I was looking for a retirement move, a city for a second home or a new business location, I would analyze this list and report closely.
To be considered a “big mover,” a state must have shifted position by more than five spots between the 2016 and 2017 editions. The major drivers of fiscal performance for states this year were the implementation of new accounting standards that require the reporting of pension liabilities on the balance sheet, a steep drop in the price of oil, changes in tax policy, and budget cuts.
There were many more fluctuations in overall fiscal performance this year, compared to last year’s edition. Alaska, Colorado, Louisiana, New Mexico, Pennsylvania, and Texas all dropped significantly in the overall ranking of fiscal condition, while Arkansas, Connecticut, Delaware, Hawaii, Maine, North Carolina, and Oregon improved significantly.
We also have a crane update in the event you are looking for a new high rise
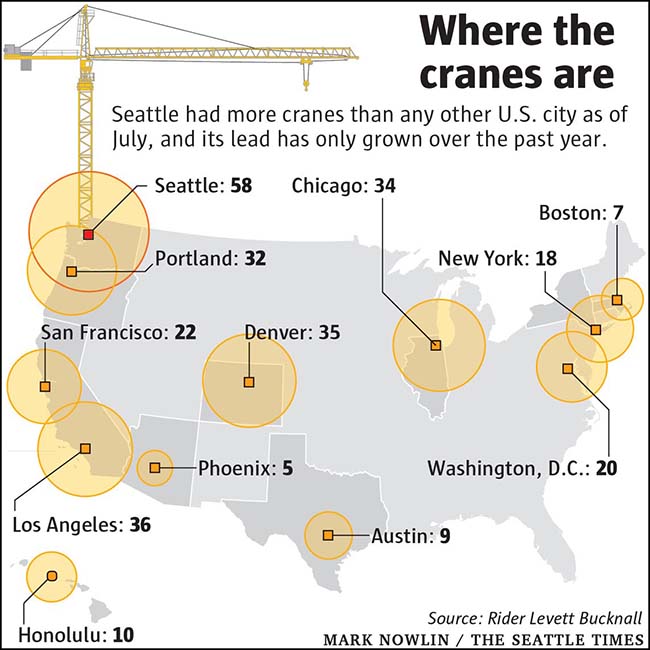
For the second year in a row, Seattle has been named the crane capital of America and no other city is even close, as the local construction boom transforming the city shows no signs of slowing.
Seattle had 58 construction cranes towering over the skyline at the start of the month, about 60 percent more than any other U.S. city, according to a new semiannual count from Rider Levett Bucknall, a firm that tracks cranes around the world.
Seattle first topped the list a year ago, when it also had 58 cranes, and again in January, when the tally grew to 62.
The designation has come to symbolize, for better or worse, the rapid growth and changing nature of the city, as mid-rises and skyscrapers pop up where parking lots and single-story buildings once stood.
And the title of most cranes might be here to stay, at least for a while. The city’s construction craze is continuing at the same pace as last year, while cranes are coming down elsewhere: Crane counts in major cities nationwide have dropped 8 percent over the past six months.
And here is where the cranes are not: Retail development
If you have illiquid retail real estate on your books, sit down for your next valuation update.
Nadeem Meghji, head of North American real estate at Blackstone (NYSE:BX), said:
The retail industry is clearly facing headwinds. And it’s the first time we’ve seen secular rather than cyclical headwinds. We’re now seeing pressures even on luxury retailers, which I didn’t expect to happen as fast as it has.
The market for second-tier enclosed malls has virtually frozen given how concerned investors are, but Mr. Meghji estimated that in the past two years prices may have plunged as much as 40 per cent on average for the 1,100 enclosed regional malls in the US. Even for the top 50, prices have probably declined by 20 per cent, the Blackstone executive said.
The private equity firm’s $102bn real estate arm still owns some grocery shop-anchored malls in high-density population areas, but no longer has any exposure to the enclosed shopping mall sector.
Mr. Meghji said:
The internet has made the value proposition for a lot of shopping malls less relevant. If you add in the factor that they actually tend to have higher operating costs due to security, electricity and so on, then they are high-cost rental spaces for retailers.
Speaking of falling values
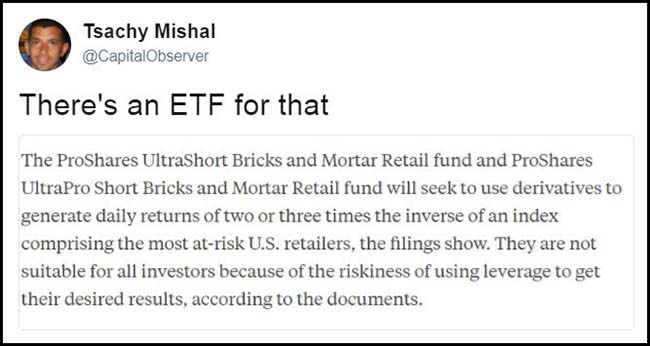
While there may be a leveraged short ETF to bet against the retail industry, if you really think a group of stocks in an ETF are going to zero, don’t buy the leveraged short ETF. A better move is to build your own basket of the worst stocks in the ETF and short them individually. Then if some of them go to zero, you won’t ever have to cover them and pay taxes so your returns should be much improved. Leveraged ETFs might be okay for a few days’ trade, but they aren’t meant for the long haul and won’t give you the ability to avoid taxes on the goose eggs.
Finally, the GOAT of the Week
Disclaimer: The information presented here is for informational purposes only, and this document is not to be construed as an offer to sell, or the solicitation of an offer to buy, securities. Some investments are not suitable for all investors, and there can be no assurance that any investment strategy will be successful. The hyperlinks included in this message provide direct access to other Internet resources, including Web sites. While we believe this information to be from reliable sources, 361 Capital is not responsible for the accuracy or content of information contained in these sites. Although we make every effort to ensure these links are accurate, up to date and relevant, we cannot take responsibility for pages maintained by external providers. The views expressed by these external providers on their own Web pages or on external sites they link to are not necessarily those of 361 Capital.

